
Green Travel Data

What is Green Travel Data?

Green Travel Data primary logo

Green Travel Data is the outcome of the Green Travel Pledge, which is the rail industry’s commitment to provide detailed, accurate and reliable data on the carbon emissions of rail journeys so that:​

  • Microscope icon

    ​The sustainability benefits of travelling by train become clearer and even more compelling;​

  • Signpost icon

    Travellers are empowered to make more informed choices through easy access to the sustainability credentials of their chosen journey

  • Counting symbol

    The business and leisure travel sector can make data on rail journey emissions easier to access and use at the point of sale;​

  • Green icon

    Businesses can accurately measure the emissions of their rail travel to track their progress against sustainability goals.

The data will help encourage travellers and businesses to shift away from more polluting modes such as car and plane, which will stimulate additional journeys by rail.

Green Travel Data is a rail industry initiative being led by the Rail Delivery Group to create a recognised industry benchmark for carbon emissions.

Encouraging modal shift to rail for all travellers

This is the first time the rail industry has combined granular data on train occupancy, fuel type, exact journey distance and many other factors.

We’ve developed a new rail carbon calculator which displays our detailed, accurate and reliable emissions data for almost every direct rail journey in Great Britain.

This new tool allows businesses and travellers to easily check and demonstrate the green credentials of switching to rail travel from less environmentally friendly alternatives such as car and plane travel.

This tool is available now and can be displayed on your phone, website and other platforms to enable travellers to make considered travel choices.

April 2025 - Fully refreshed and updated data available

Building on our Phase 2 in July 2024 where we released carbon emissions data for over 40,000 direct station-to-station routes (over 80,000 journeys accounting for travel in both directions), we’ve now expanded the scope and accuracy of our data to cover:

  • All rail travel types: Green Travel Data now supports both business and leisure travel, with weekend data now included.
  • Car emissions comparisons for leisure travel: Updated car emissions figures based on national average car occupancy enable more accurate comparisons.
  • Air travel emissions data: Comparisons available on routes where scheduled flights are available.
  • Improved class-based emissions breakdown: First and Standard Class emissions are now calculated based on space occupied per passenger, ensuring more precise results.
  • Improved energy consumption data: More accurate energy usage figures for different train fleets.

We’re also working to ensure that Green Travel Data is externally verified in the near future.

The results from our latest data shows that rail is up to 13 times greener than flying in Britain. The comparison with road journeys varies based on the loading of the train, and the type of train used, but is shows that carbon emissions are lower by rail on 85% of over 40,000 direct station-to-station routes (over 80,000 journeys accounting for travel in both directions) and 93.76% of passenger journeys on those routes when compared to travelling by petrol/diesel car (based on the national average of 1.6 passengers per car).

Online carbon calculator

Use our new online Green Travel Data carbon calculator to compare the emissions of your direct rail journey against an equivalent car journey and flight (for routes where flights are available). 

You can also embed the calculator on your own website - just follow these instructions.

Try the calculator yourself below

Enter your origin and destination stations below to instantly compare carbon emissions across different modes of transport for your journey.

Access the Green Travel Data

In addition to our online carbon calculator above, the latest full dataset is available on the Rail Data Marketplace (RDM).

Please register through RDM (if your organisation is not already registered) and request access to Green Travel Data by following the RDM Instructions Guide.

Download and use the Green Travel Data kitemark logo

If you're using or featuring our carbon calculator or emissions data, you can show your support for greener travel by displaying the Green Travel Data kitemark.

Please refer to the logo usage guidance below, and download the logos here.

Green Travel Data primary logo
Green Travel Data secondary logo in horizontal orentiation

Use the primary lock-up as the default logo across all communications to ensure clear and consistent branding (e.g. websites, journey planners, promotional materials)

Use the secondary lock-up where the National Rail accreditation mark is already prominently displayed, such as on National Rail-branded content or apps.


Image of Jac Starr smiling

"Green Travel Data has been developed in partnership with industry experts. As well as business routes, it also now includes leisure journeys, with data covering all seven days of the week to allow us to independently demonstrate the environmental credentials of rail travel."

Jacqueline Starr,
Executive Chair & CEO at the Rail Delivery Group


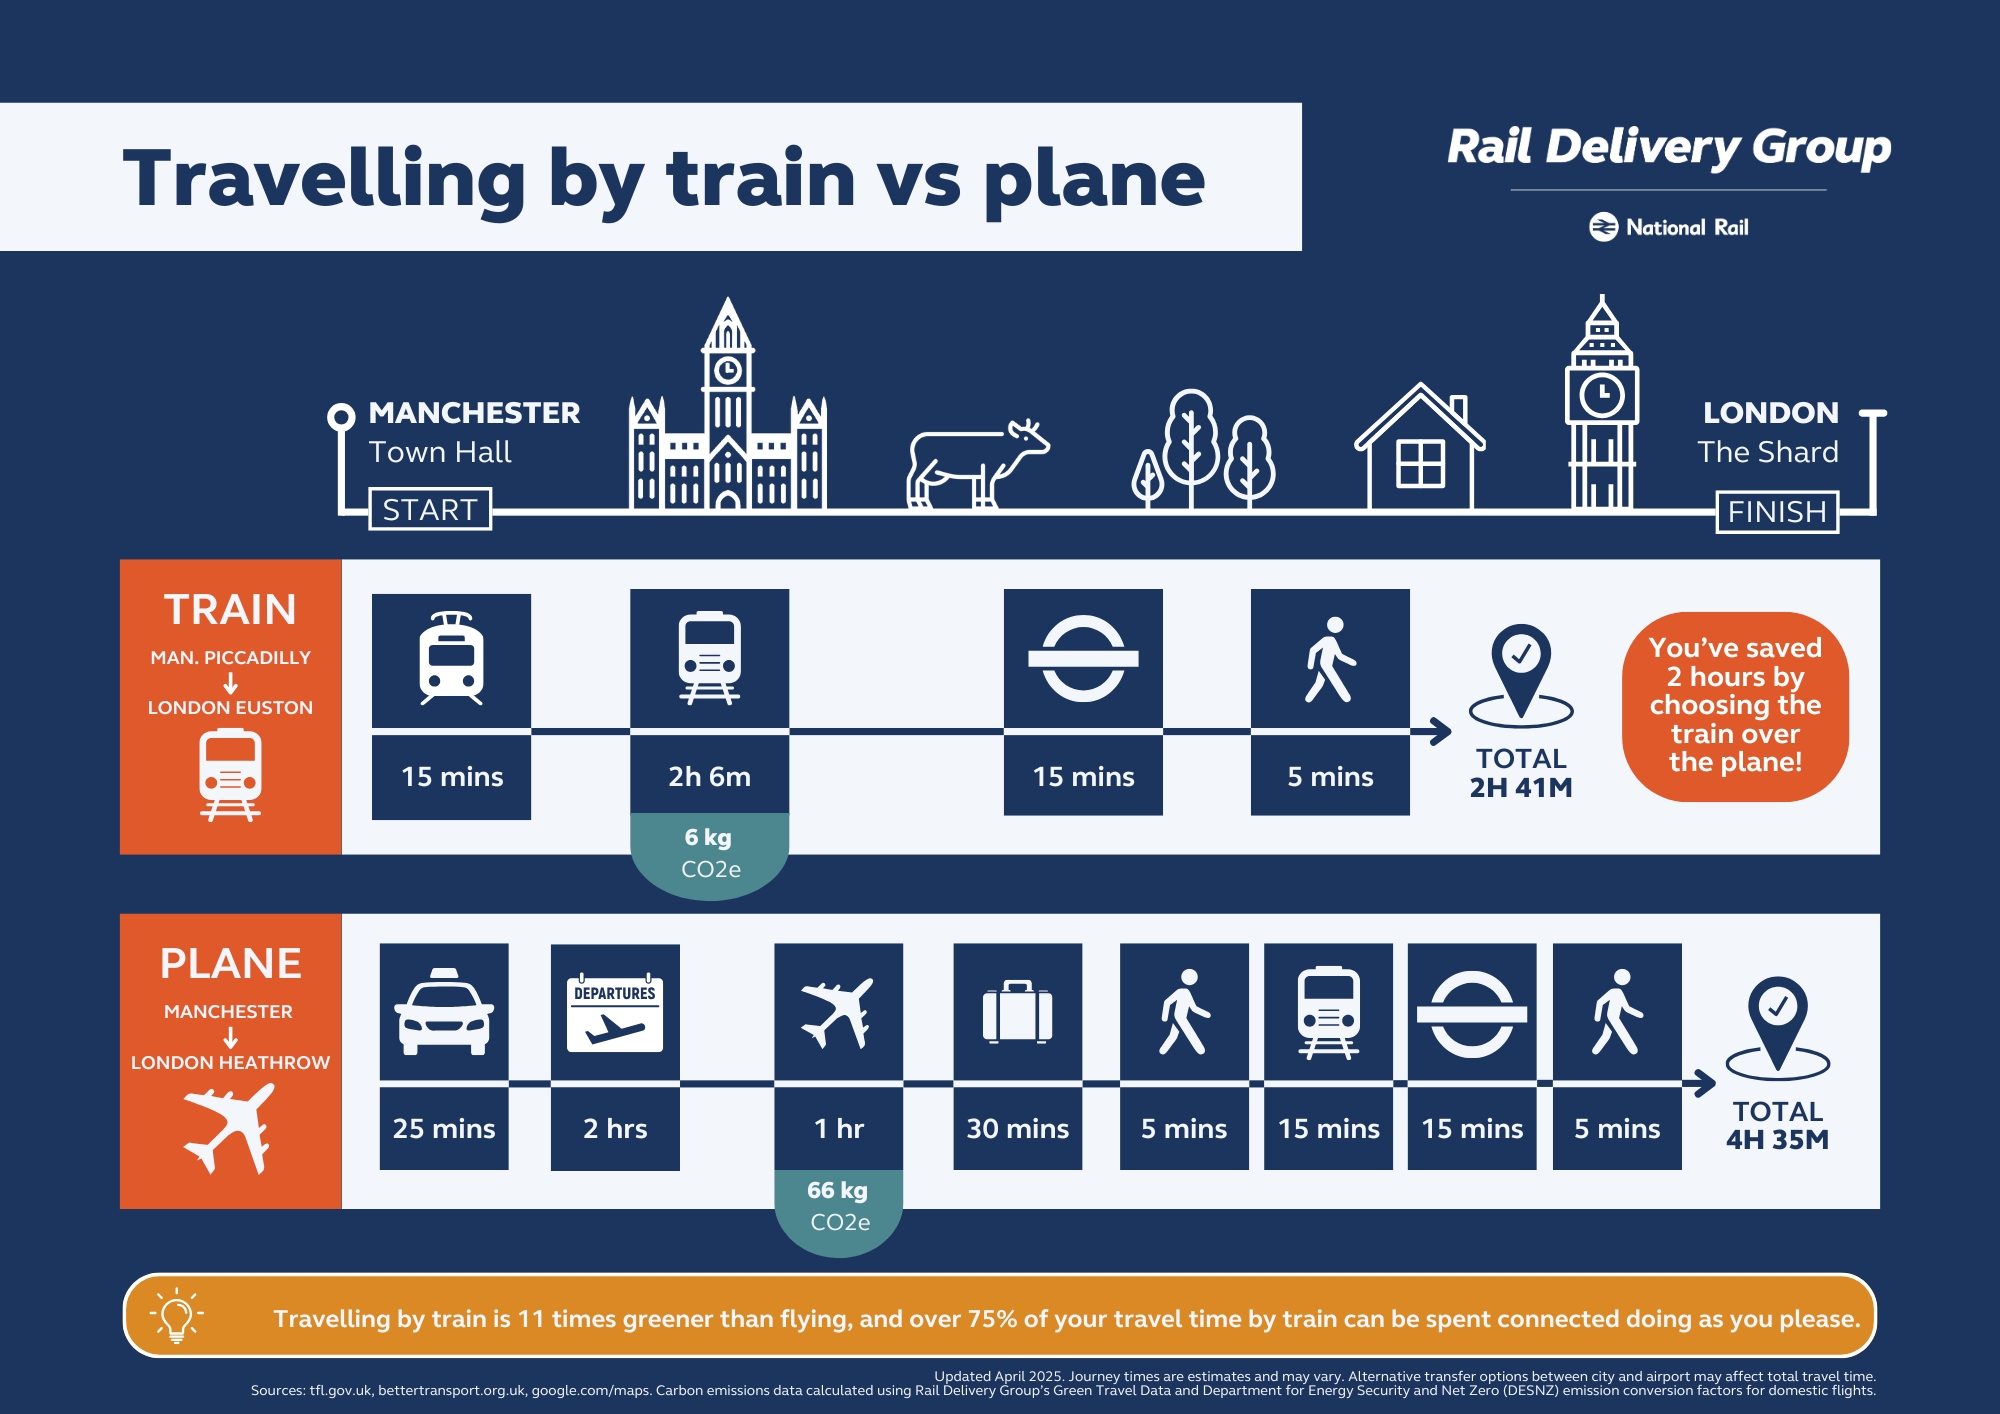
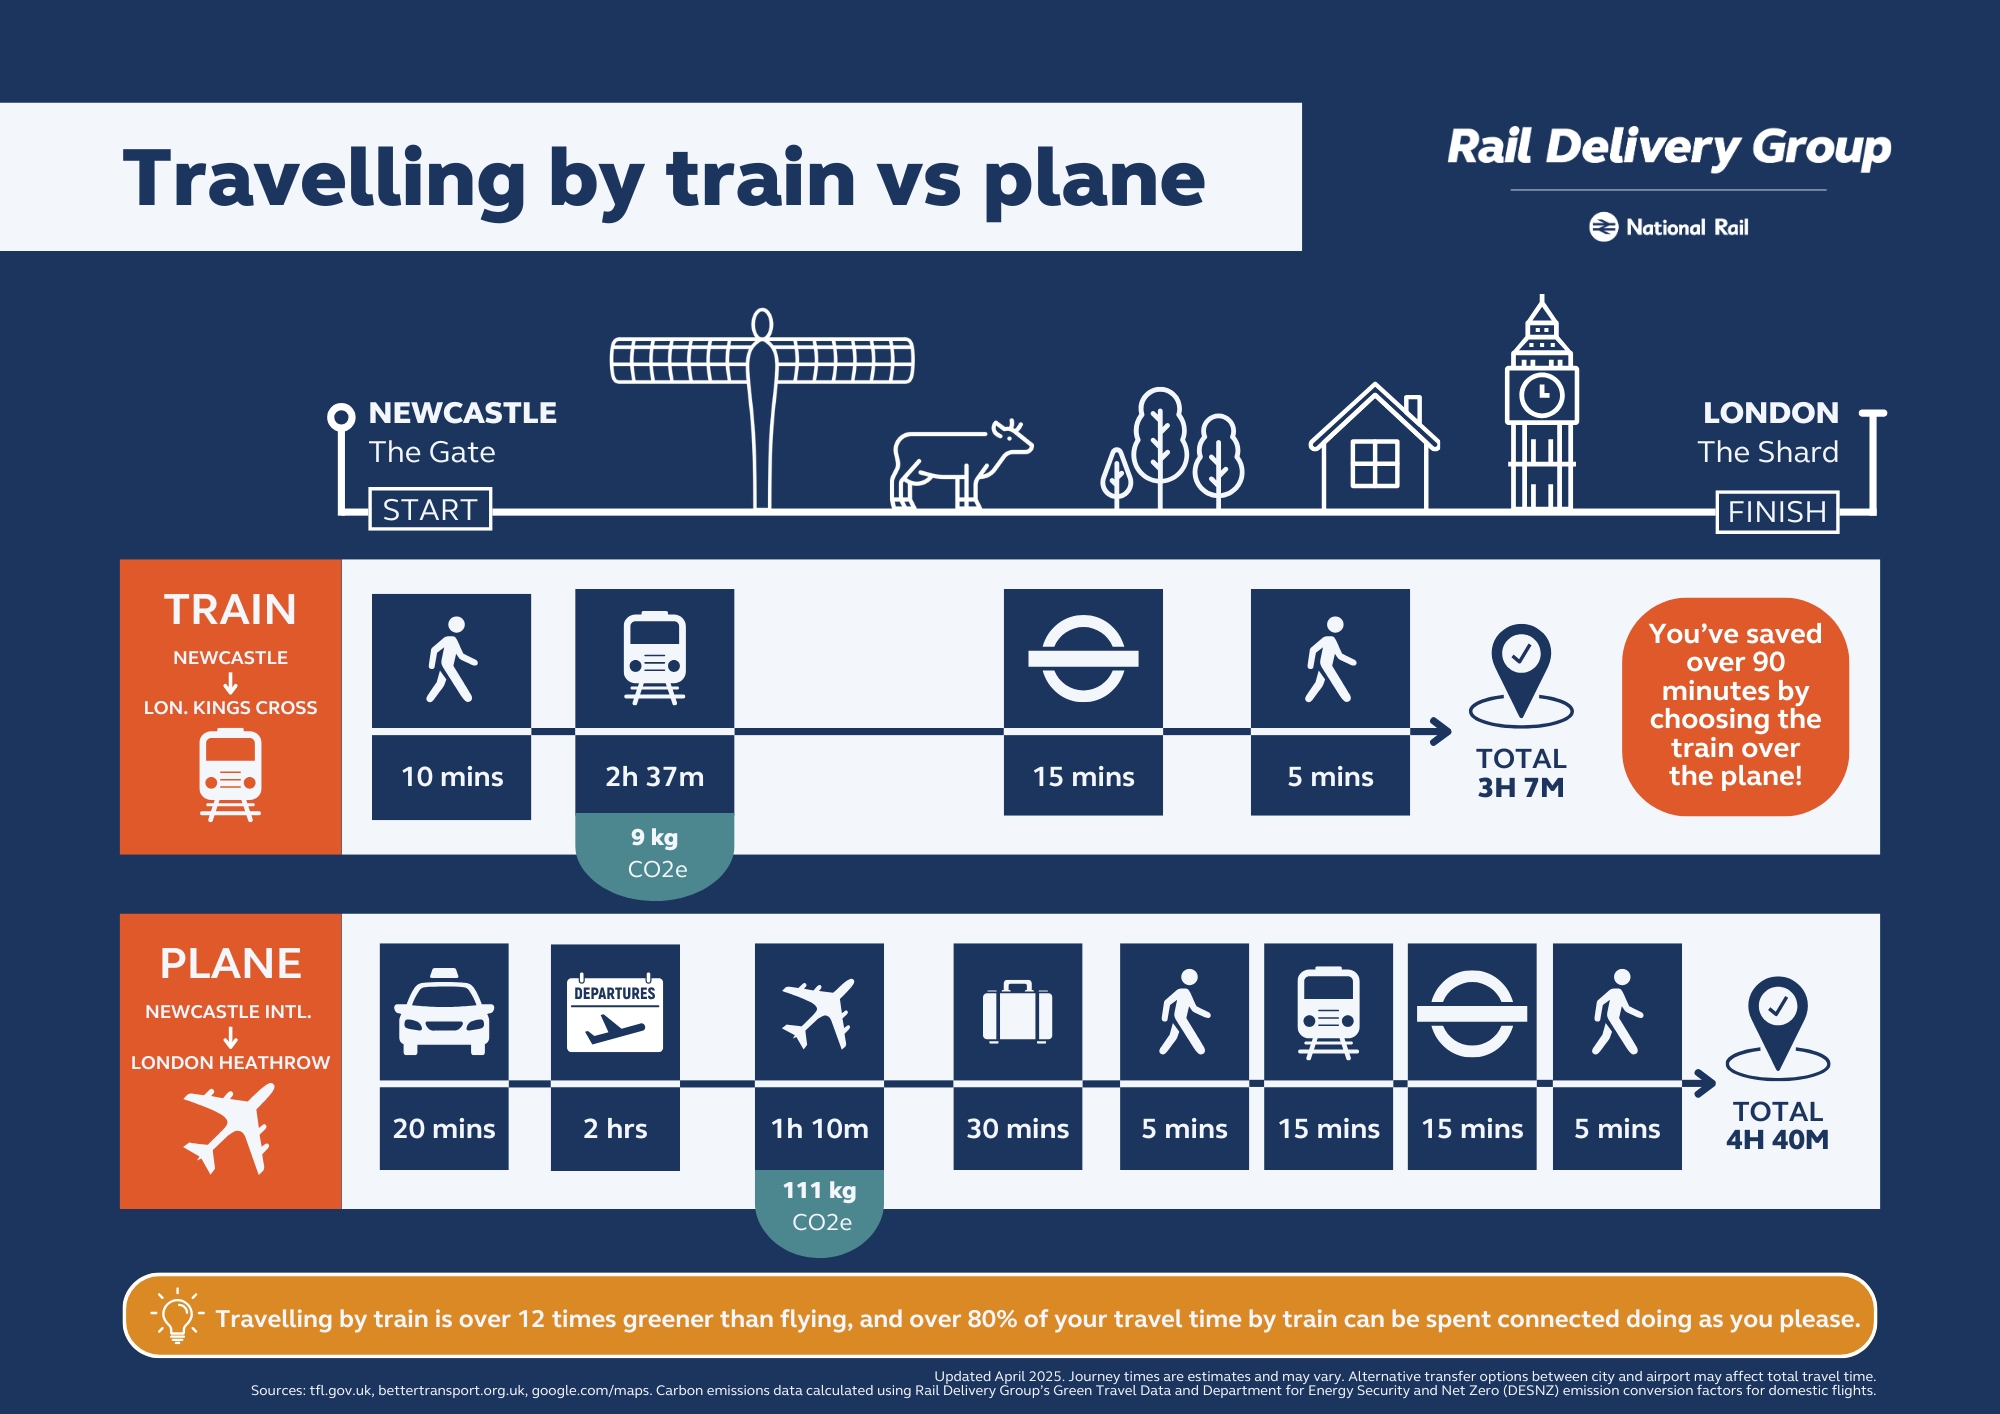
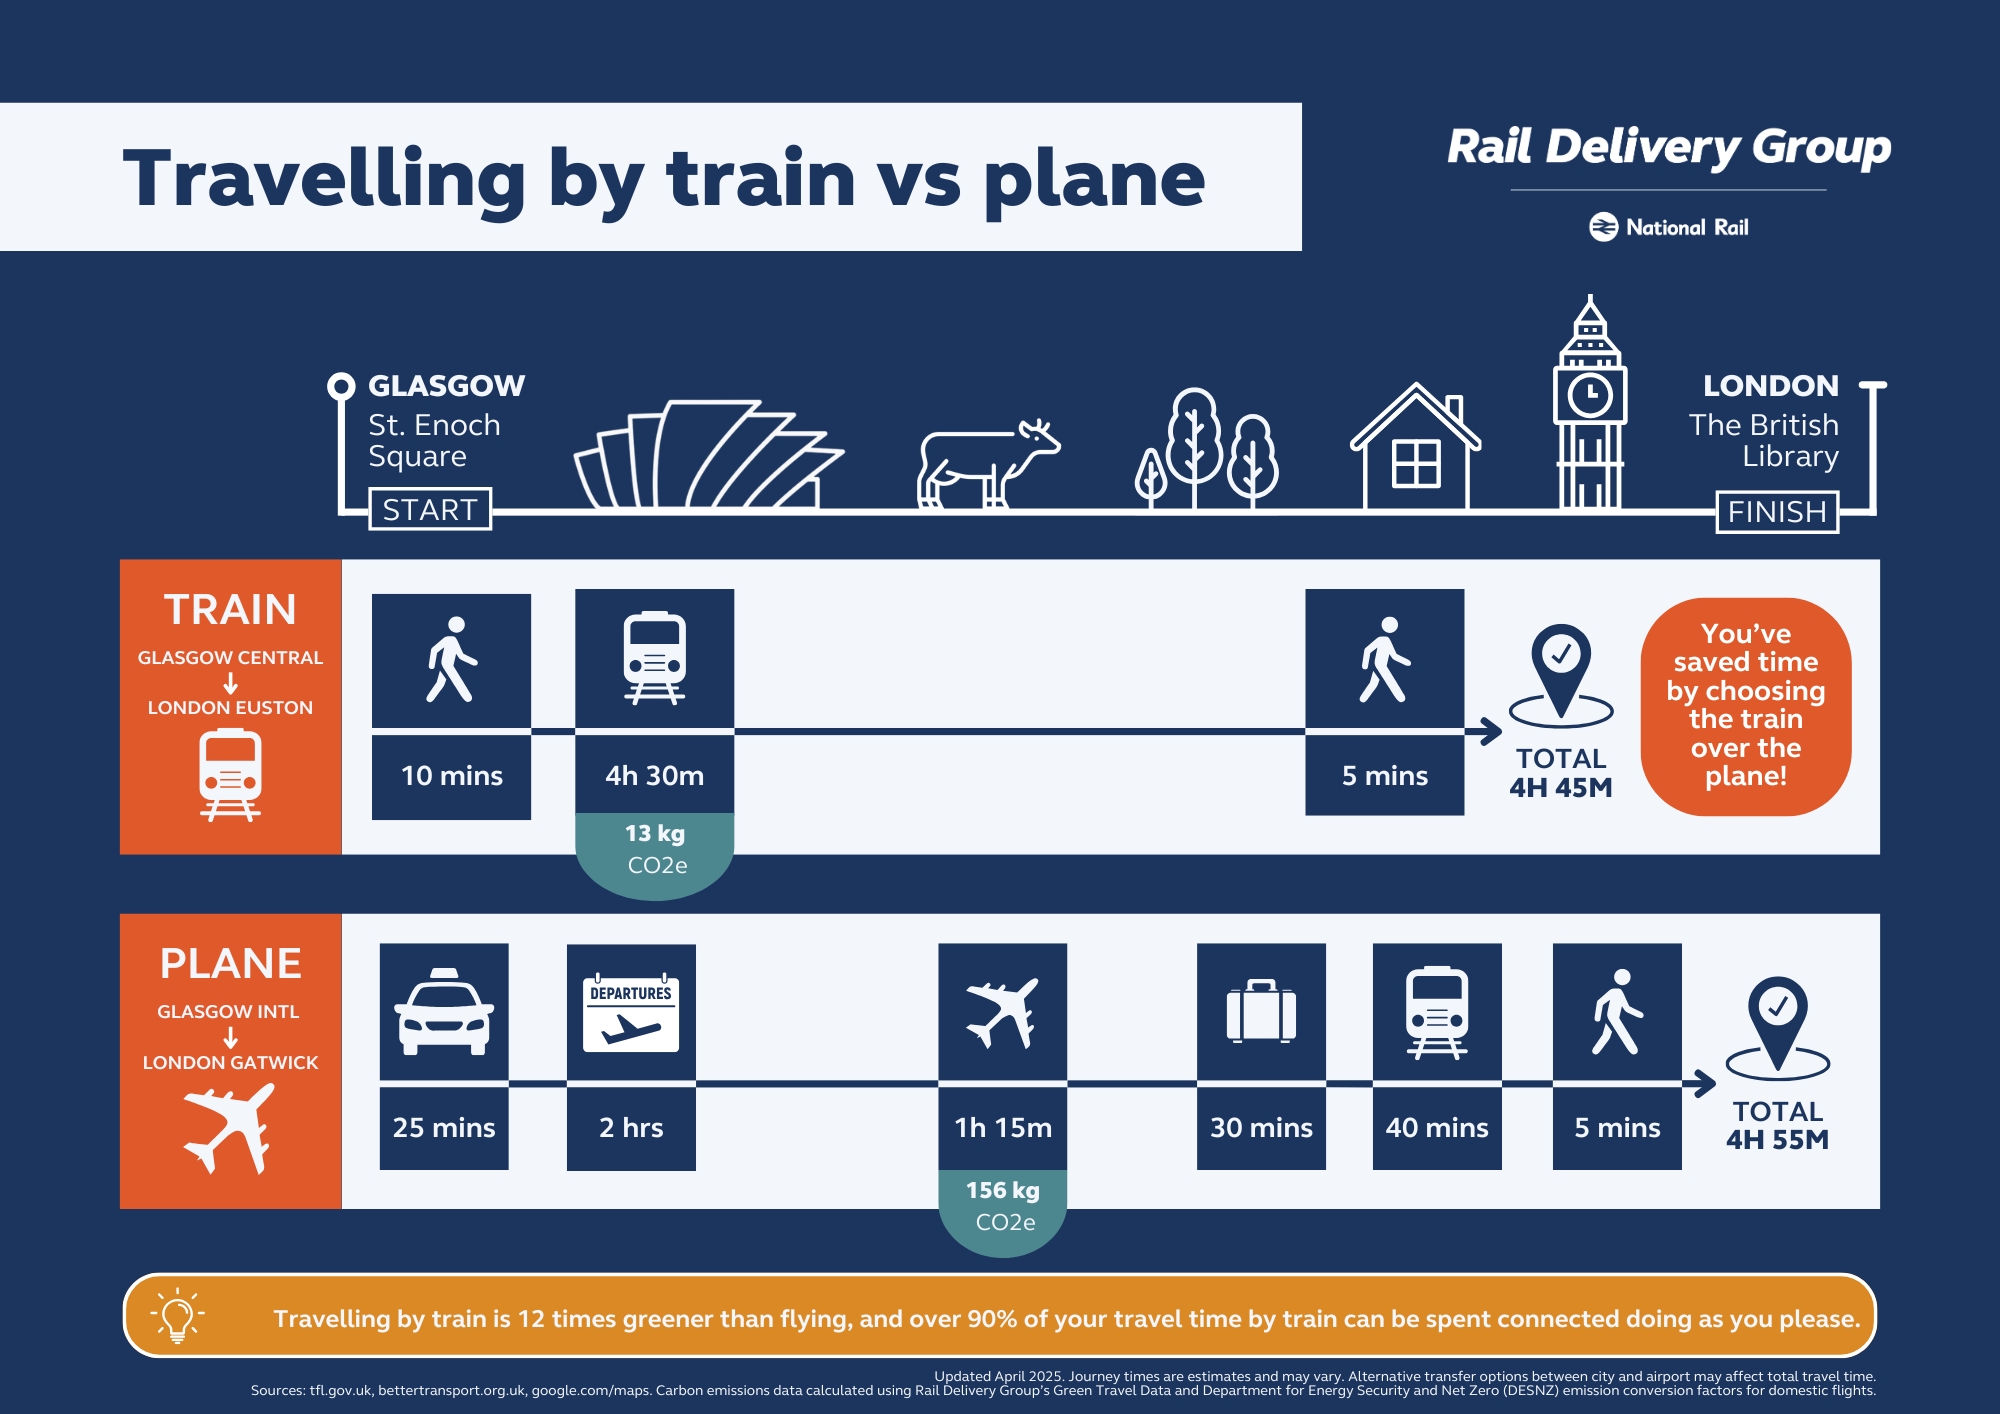
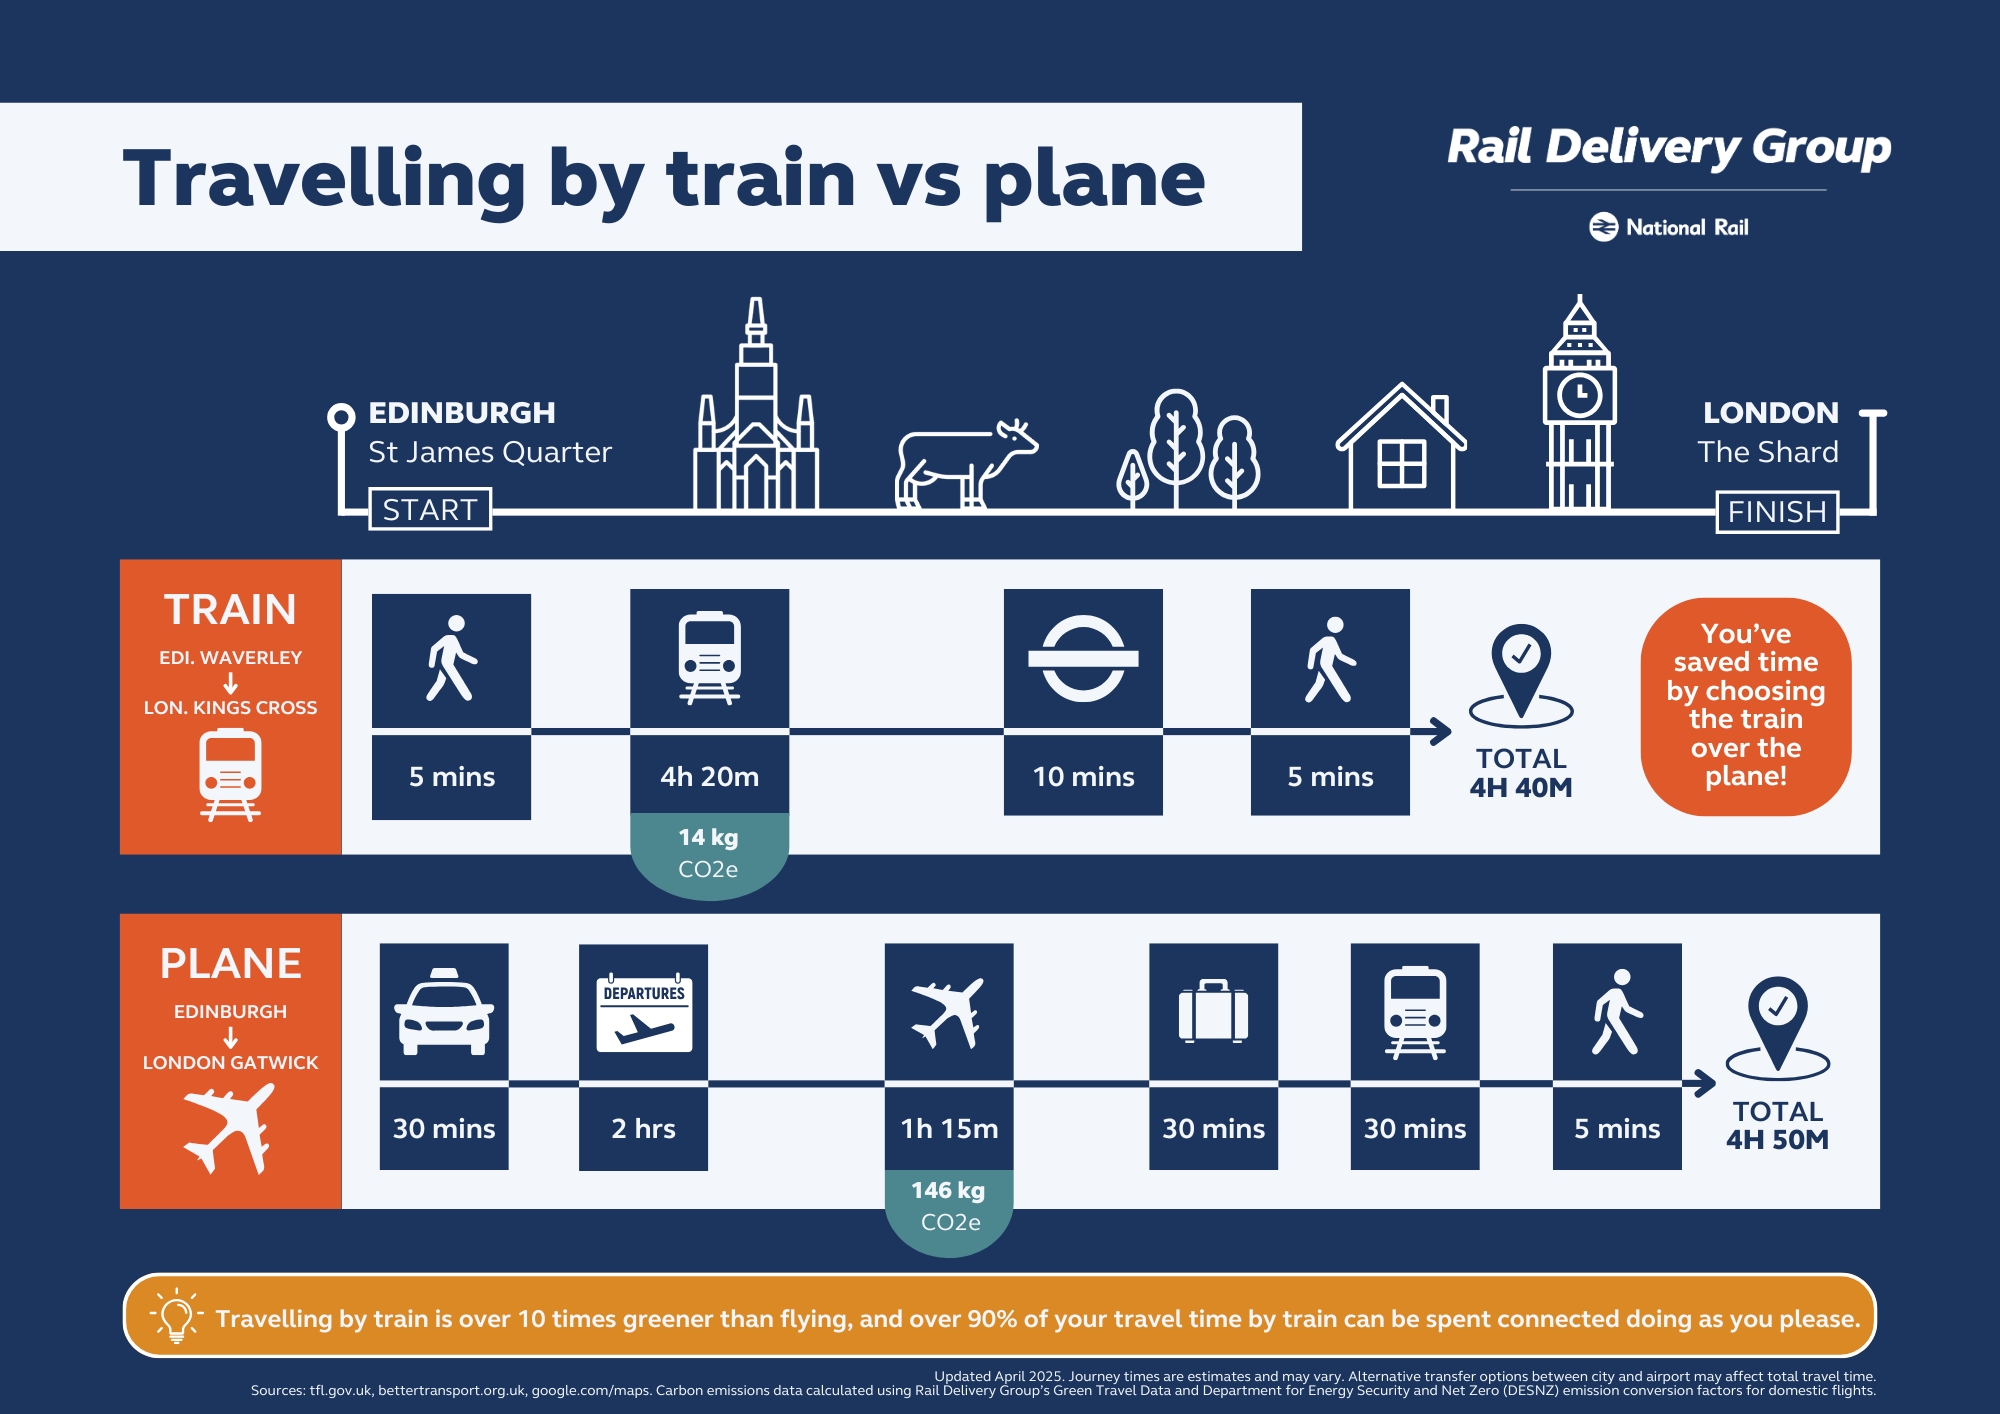
Train vs plane: carbon emission comparison for four domestic business travel routes

We have compared per passenger emission data from rail routes in Britain with the equivalent per passenger emission data for the same trip by plane (using Department for Net Zero figures on emissions for domestic air travel).

It shows that rail is up to 13 times greener than flying for business travel in Britain.

You can learn more about the benefits of travelling domestically by rail instead of flying by viewing the graphics below or reading our latest report Clearing the Air: Train vs Plane (note that the emission figures in the Clearing the Air report are based on September 2024 Green Travel Data).

Comparison of train and plane journeys for a trip from Glasgow to London, highlighting rail's speed, eco-friendliness, and greater productivity time.
Comparison of train and plane journeys for a trip from Manchester to London, highlighting rail's speed, eco-friendliness, and greater productivity time.
Comparison of train and plane journeys for a trip from Edinburgh to London, highlighting rail's speed, eco-friendliness, and greater productivity time.
Comparison of train and plane journeys for a trip from Newcastle to London, highlighting rail's speed, eco-friendliness, and greater productivity time.

    You’re welcome to download these graphic tiles which have been designed for sharing on social media, webpages, presentations and publications. Simply right click on the links below and click ‘Save link as’ to save the image file.


    Image of award with text saying Green Travel Pledge: Proud winners of Sustainability & Net Zero Team of the Year at the Rail Staff Awards 2023 and finalists for Innovation of the Year at the Rail Business Awards 2024 and Sustainability and Environmental Excellence in 2025.

    Initial calculations

    In June 2023 the initial data looked at one specific route, London King's Cross to Edinburgh Waverley, which showed rail travel emits 10 times less carbon than car travel.

    Learn more

    Read about how carbon emissions expertise from Thrust Carbon and rail data experience from 3Squared are being combined to develop reliable and accurate carbon emission figures.

    Latest news

    See the latest news about the Green Travel Pledge and other rail industry initiatives being led by the Rail Delivery Group.


    Frequently asked questions

    We want to have an open and honest conversation about the carbon footprint of business travel in Britain.

    To support that, we've compiled some questions and answers you may have about Green Travel Data. We'll look to expand on these as we move closer to releasing carbon emission data for rail journeys across Britain.

    To view each answer, just click the + icon next to the question.

    A blurred train passing a green signal

    Questions about the Green Travel Data refresh (updated April 2025)

    What is Green Travel Data?

    Green Travel Data is the outcome of the Green Travel Pledge which is the rail industry's commitment to provide detailed, accurate and reliable data on the carbon emissions of rail journeys so that:

    • Travellers are empowered to make more informed choices through easy access to the sustainability credentials of their chosen journey
    • The sustainability benefits of travelling by train become clearer and even more compelling.
    • Travel retail and information providers can make data on rail journey emissions easier to access and use for the traveller;
    • Businesses and travellers can accurately measure the emissions of their rail travel to track their progress against sustainability goals.
    • The data will help encourage business and leisure travellers to shift away from more polluting modes such as car and plane, which will stimulate additional journeys by rail.

    It is a rail industry initiative being led by the Rail Delivery Group (RDG), in partnership with Great British Railways Transition Team (GBRTT), creating a recognised industry benchmark for carbon emissions

    Does Green Travel Data data exist for other transport modes?

    Green Travel Data focuses on providing the most accurate data possible for rail journeys. We are also working to present it alongside accurate data of other modes of transport.

    Is Green Travel Data carbon emission data per passenger or per train?

    The calculation is per passenger. This takes into account occupancy data to provide a reliable figure for how many people will be using each route.

    At the Point of Sale (PoS), how will Green Travel Data be displayed?

    It is intended that Green Travel Data emission values for each journey will be displayed alongside journey results in journey planners and web ticketing services. An API is being developed to make it as easy as possible for retailers and information solution providers to consume the data.

    I've seen a carbon calculation for my rail journey when I booked, was this a figure created using the Green Travel Data carbon calculation methodology?

    No, there are many different methods for calculating carbon emissions for train journeys.

    We believe it's important that the rail industry works from one reliable, accurate and consistent measurement of carbon emissions. That is why we are using granular data to make Green Travel Data carbon emission data as reliable as possible.

    We plan to continue to roll Green Travel Data out to new travellers, additional businesses, online booking tools and travel management companies etc.

    How do you calculate carbon emissions for rail?

    We have been working with carbon emission experts at Thrust Carbon and rail data specialists at Fab Digital to compile rail data and use it to accurately calculate rail emissions for all point-to-point rail journeys in Britain.

    Data used includes engine type, fuel type, journey distance, number of carriages, travel class, occupancy and timetable.

    Details of the full methodology used to calculate the figures is available via the Rail Data Marketplace.

    Why is this methodology important?

    Other emission measures, such as the one maintained by DESNZ (the Department for Energy Security and Net Zero) and still colloquially known as the 'Defra methodology', offer a general average emission figure for all customers on rail services in Britain. However, they do not differentiate between various factors including different classes of travel, load factor, or electric vs diesel power units.

    The 'Defra methodology' calculates a single emission factor for the average passenger per kilometre, which, while useful for high-level comparisons, does not accurately reflect the emissions associated with individual passengers on specific journeys.

    Our Green Travel Data methodology fills this gap, offering a more granular and nuanced understanding of rail emissions. It considers the specific characteristics of different rail routes and allocates emissions to individual passengers based on the following (not exhaustive): number of carriages dedicated to each class, the average load factor for each class, and the volume of trains run on each route.

    This approach can provide a more accurate measure of the emissions associated with individual passengers and can serve as a powerful tool in enabling more accurate reporting on rail emissions for businesses, whilst also shaping strategies for emission reduction in the rail sector.

    What data do you use to calculate the emissions for a train journey?

    Our carbon calculations for rail take into account: engine type, fuel type, journey distance, number of carriages, travel class, occupancy and timetable.

    Why do the figures change from one release to the next?

    We will update the data each time a new timetable is introduced. This can lead to a change in passenger behaviour, which can affect the passenger numbers on a particular route. Additionally the types of train that operate the service may change, leading to a different emission value for the train itself.

    The scope and accuracy of the data is also evolving continually as we work to make our data as accurate and representative as possible. Recent changes that may have an impact include:

    • expanding the scope to include weekends.
    • updating the assumed car occupancy to better reflect leisure and business travel. (from 1 to 1.6 people per car).
    • incorporating new data on the emission values of trains.
    What is the difference between Green Travel Pledge and Green Travel Data?

    The Green Travel Pledge was the rail industry commitment to develop an accurate, consistent and independent set of sustainability data for the rail industry.

    The output of the pledge is our Green Travel Data. As the data becomes more widely available, it will be referred to as Green Travel Data in future. We are developing a new kite mark for Green Travel Data so that you can know that your preferred supplier is using approved data when you see it.

    How do you factor in train splits and joins into the methodology?

    Our methodology uses the number of carriages and number of passengers between any two station stops on a journey and aggregates these. As such, any joining or splitting of trains would be factored into the overall emission calculations for the route as this would alter the number of carriages and passenger load at the appropriate point.

    How do you factor in different fuel types, like diesel?

    Our methodology takes into account the type of train - electric or diesel - operating on specific routes. This allows us to estimate emissions accordingly. Where trains change from electric to diesel (and vice versa) en route, we will take this into account.

    What happens if the train I was on got cancelled and a diesel train was used, how will the figures be updated?

    At this stage, we will not be factoring in 'one-off' train cancellations. We will only factor in changes if they substantially impact the rail timetable.

    What happens when my train changes from electric to diesel power during the journey?

    For these journeys, we are able to identify the emissions for each part of the journey, and as such can calculate the emissions for the entire route, even if the route is partially electric and partially diesel.

    What journeys does the data cover?

    Only direct journeys are currently included. We have recently expanded the scope to cover journeys on all seven days of the week.

    There is a small number stations with a direct service between them (approx. 1% of the total) that are not covered in the results.

    These journeys are missing because passenger loading information isn't available for the current timetable, typically because the timetable has changed recently, or there is long term engineering work affecting services.

    Does the data cover business and leisure travel?

    The initial focus of Green Travel Data was to cover the key business travel routes. The scope has now been broadened to cover all direct journeys, both business (B2B) and leisure (B2C).

    Why does the emission value differ for the same journeys from one set of data to another?

    As part of our ongoing analysis, we continually improve our algorithms and implement enhancements to achieve higher accuracy in our calculations. Additional data sets are also included when they become available. We also update the input data to reflect the latest timetable, train routing, rolling stock and passenger numbers at the time of publication. Any of these can result in variations in emission values.

    My journey includes a change of train, why is it not shown in the data?

    Only direct journeys are currently included. If a journey includes a change of train, that journey is not currently covered by green travel data.

    We are working to widen the scope to include indirect journeys in future phases.

    Why are the emission figures on some routes higher than others?

    Green Travel Data considers a number of factors to ensure that the results are specific to each route. The journey distance, the number of passengers making the journey, the number of carriages on the train, and the type of rolling stock used will influence the exact emission value.

    Busier routes will see lower per passenger emission figures. On routes where older train fleets are currently used, the emissions may be higher. The results of Green Travel Data can be used to help inform future rolling stock replacement and electrification projects which will increase the sustainability of services across the network.

    How is the car emission data for each route calculated?

    Car emissions are sourced from the Government's Department for Energy Security and Net Zero, Greenhouse gas reporting: using the latest published conversion factor, using the Business Travel - land data set.

    Initially, as Green Travel Data was focused on business travel, the 'Executive car' kgCO2e per km figure value was used. As the scope has been expanded to cover leisure journeys too, the values now used are for the average car size.

    The route distances were calculated using the OSRM (Open Source Routing Machine) project. Coordinates for each station pair were processed to determine the shortest road route. If a station wasn't directly accessible by public roads, the nearest accessible road was used.

    By multiplying the 'kgCO2e per km' figures with the route distances, we calculate emission values for petrol/diesel, hybrid plug-in electric, and battery electric cars for each journey.

    The emission value is then divided by the national average of 1.6 passengers per vehicle to calculate a per-passenger value.

    It should be noted that in previous sets of data, car occupancy was assumed to be one person, which is typical of business travel. This change in occupancy has seen a reduction in the resulting per-passenger car emission values.

    Why do a small number of train routes have relatively high emissions?

    While train travel is usually greener than other modes of transport, emissions can be relatively high on a small number of routes. This variation can be due to a number of factors, including low passenger numbers or, as only direct journeys are currently covered, those direct journeys only occurring at less busy times.

    An example of this is the result for journeys between Ipswich and Harwich International. The emission value is particularly high as there are only four direct trains between this station, all of which have lower passenger numbers. The majority of journeys between these two stations are indirect, and if taken into account, would reduce the emission value per passenger considerably.

    The work to include both direct and indirect journeys in the results will form part of future phases.


    Questions about the methodology behind the carbon emission calculations


    Does this data incorporate short term service changes caused by industrial action, engineering work or service disruption?

    No, the data is based on the planned, long term timetable which is refreshed twice a year. This doesn't reflect any short term variations but assumes typical conditions for the route. We plan to look at how real time variations can be covered in future phases.

    Which emissions factors are used?

    Green Travel Data uses the UK Government's most recently released set of emission conversion factors, which are published by the Department for Energy Security and Net Zero (DESNZ).

    Are CO2e emissions for the train journey divided by the current average number of passengers per train?

    Green Travel Data identifies all direct services between the two station and works out the emission value for each service (per km emission value for the booked train type x the distance).

    The average passenger load on each train is derived from the passenger count for each station-to-station segment of the journey.

    From these values, we calculate average emissions of trains specific to journeys between the specific to stations.

    Why is there a difference between per passenger emissions for train services to railway stations in the same city (e.g. Edinburgh Waverley and Haymarket Station)?

    Green Travel Data per passenger emission figures take into account a lot more than just the distance of the journey.

     The type of train (and fuel it uses), the number of carriages that make up the train and the number of customers on the train (especially off-peak services that may be quieter at certain times of the day) can heavily impact the overall per passenger emission figure on each route.

    For rail emissions, what is the basis of the emissions for the electric train? Is it kWh per km? If so, what is the source of the data?

    Energy values per kilometre are derived for electric trains from Network Rail EC4T data. We are continuing to gather data from as many sources as possible to better improve our emissions calculations.

    What occupancy figures are used to create the per passenger emission figure for rail travel?

    Green Travel Data uses MOIRA modelled data to derive the loading for each direct service between any two station pairs. From this we can work out the passenger mileage between those two points and from that the average loading value for all services. This data is currently derived from the May 2023 timetable. Future data publications will be updated to reflect the forecast for the latest timetable. Please refer back to the Green Travel Data website for any updates.

    Does Green Travel Data methodology include passengers standing?

    Yes, as the data used includes passenger load, this will include all passengers on that train.

    Do you take into account travel on the weekend?

    The scope of Green Travel Data has been expanded in include all journeys made, seven days a week.

    Are journeys by rail replacement bus included within Green Travel Data data?

    Whilst Green Travel Data doesn't currently take short term engineering work into account, any buses operating as part of the long term (six monthly) timetable will be incorporated using emission conversion figures for local buses for the UK Government's Greenhouse Gas Conversion factors.

    Do you take into account rail staff travel?

    If a ticket is purchased for travel or a seat booking is made, then this would count towards the occupancy figures we use to calculate the per passenger emissions. There are some cases in which a pass or on the day upgrade is purchased, which may mean that we do not take then into account certain journeys.

    Do you consider catering on the train?

    Energy used on the train for heating food and drink, and energy required to move the portion of the train using by catering areas are included in the train emission figures.

    Do you consider how staff get to the station to support the running of the train (train drivers, station staff, etc)?

    How staff get to the station to support the running of the train is not included in this phase of the initiative but will be considered in planning future phases.

    Are all train operators included within Green Travel Data?

    We have received data from the vast majority of train operators including all government contracted services. All routes are covered.

    If timetables change, how is this considered?

    Timetables typically change every six months in the rail industry. Our figures will be updated to reflect any changes made in the timetable to train routes or passenger volumes.

    How often is the data refreshed?

    We plan to refresh our data twice a year, in line with when new timetable data is published for the GB rail industry.

    Which timetable and passenger load data are you currently using?

    The results are based on the timetable that was current between June and December 2024. A process will be put in place shortly to refresh data to incorporate the latest timetable which runs from December 2024 to May 2025, and passenger loads twice a year after each timetable change.

    With First Class included within the seven data points, what First Class tickets are included?

    Passenger forecasted data is used for the Green Travel Data, which includes first class data captured at the point of sale.

    First class ticket upgrades, whether through an external auction site, operators own upgrade pre departure site, walk up upgrades, on board upgrades are not currently included, however we are looking at how this can be incorporated, in future phases.

    Some train operators have recently permanently declassified their First Class to Standard Class, how is this factored into the data?

    Some train operators under instruction from the Department for Transport (DfT) have withdrawn First Class from their services, in these cases, all travellers are considered to be travelling in standard class accommodation.

    On certain routes and certain journeys, first class accommodation is made available to standard class passengers due to high passenger loads, our model assumes passengers will be travelling in the class of accommodation of the ticket they purchased.

    Are the Green Travel Data emission figures for rail business travel an average figure or specifically referring to Standard or First Class travel?

    The scope of Green Travel Data has been expanded to include figures for passengers travelling in first class and standard class separately, as well as a combined average figure for both classes. The method of calculation for each class of accommodation has been improved to better reflect the additional space taken up by each first class seat where this is the case.

    Do you count Standard Premium travel on Avanti West Coast services as Standard or First Class when estimating emissions?

    We consider Standard Premium as Standard travel for the purposes of calculating rail emissions.

    Is there potential to quantify the costs of carbon emissions as a per head/household figure in £/$/€?

    We'll be exploring methods to incorporate cost measurements into our data (including potential visualisation in £/$/€ per head/household) in the future.

    What enhancements can I expect in future phases?

    We are continually working to further widen the scope of the Green Travel Data. Planned enhancements /considerations include:

    • Incorporating real time variations to the timetable, rolling stock and passenger numbers
    • Providing results for indirect journeys
    • External ISO accreditation of Green Travel Data
    • First and last mile (by other transport modes)
    • Provide the data in an API so that it can be incorporated into point-of-sale information systems such as journey planners.
    Why is this not available to all customers when booking via train operators and retailers?

    Data is now available for all direct journeys. We hope to expand this to cover all indirect journeys in future phases and create an API which will be available for all retailers to consume at point of sale.

    Can you work out the carbon emissions for a journey using multiple train operators?

    Currently we have data for direct journeys i.e. those with no changes. Where more than one train operator runs trains on that route, the data for each will be used to calculate the final figure.

    However, in future phases we plan to include indirect journeys (those with changes), allowing rail users to have access their emissions values for multiple legs of a journeys.

    Why do only certain routes have comparisons with air travel?

    Where regularly scheduled direct flights operate between cities where there is a corresponding direct rail service, comparative figures for the journey by air are included in the results.

    Where flights operate to multiple airports (e.g. flights from Edinburgh operate to London Gatwick and London Heathrow) the air figures reflect the mean figure of the two routes.

    What data has been used for airline travel comparisons released in April 2025?

    Green Travel Data uses the UK Government's most recently released set of emission conversion factors for domestic flights which are published by the Department for Energy Security and Net Zero (DESNZ). These figures are based on the average emissions of all domestic UK flights which reflects the fact that Green Travel Data has been expanded to include both business and leisure travel.

    Which class of airline travel are you comparing?

    The DESNZ figures are based on the average split between economy and business class travel, taking into account that business class is not available on many domestic flights.

    Are Well to Tank (indirect) emissions considered as part of Green Travel Data figures?

    This isn't currently available as part of Green Travel Data data, however we are looking to include indirect factors for all transport modes in future phases.

    What fuel consumption is used for the diesel/petrol car, for car emissions?

    Green Travel Data has used the latest available UK Government’s Greenhouse Gas Conversion factors and the Business Travel by land - Unknown category for car emissions, which covers diesel and petrol cars.

    What consumption (km per kWh) is assumed for the battery electric car, for car emissions?

    Green Travel Data has used the latest available UK Government’s Greenhouse Gas Conversion factors for car emissions which covers battery electric cars.

    What is the assumed CO2 density of the electricity used to charge the battery, for car emissions?

    This energy value is then turned into an emission figure by mapping to the UK Government’s Greenhouse Gas Conversion factors.

    Does Green Travel Data take into account ‘first and last mile’ travel to and from the station?

    Not at this stage as we have focused purely on the rail journey emissions. Future phases will make our rail data available for consumption by various multi-modal journey planners and e-ticketing systems.

    Does Green Travel Data consider rail freight as part of the calculations?

    At this stage, rail freight is not part of the calculations. However, we understand there is a huge environmental benefit to rail freight's role in removing HGV congestion from our roads and are exploring opportunities to include rail freight calculations moving forward.

    Why isn't Green Travel Data data featured within Network Rail's "One train journey at a time" and "A Greener Future" campaigns?

    Green Travel Data data has been expanded to cover travel seven days a week and also leisure and business travel. As such, we are looking to incorporate it into any future campaigns.

    Is Grey Fleet (use of employee's private vehicles) factored into your comparisons with car travel?

    Yes, our calculations for car are a basic average figure for all vehicles used on British roads. While initially, data was presented on the assumption of one person in each vehicle (which is typical for business travellers), as we have now expanded Green Travel Data to include leisure travel as well, the national average occupancy on a car is now being used in our calculations.

    Questions about the project

    How are you supporting businesses to save carbon by switching to rail travel?

    We have developed a new rail carbon calculator which provides detailed, accurate and reliable data on the carbon emissions of rail journeys to businesses at the point of sale.

    This new tool allows businesses and business travellers to easily demonstrate the green credentials of switching to rail travel from less environmentally-friendly alternatives such as car and plane travel.

    As a corporate organisation, how should Green Travel Data feature within our travel policy/guiding principles?

    We want to help encourage businesses to modal shift away from car and plane travel to stimulate additional business journeys by train.

    Please contact us at This email address is being protected from spambots. You need JavaScript enabled to view it. to discuss your involvement with the Green Travel Data project.

    How do I get involved with Green Travel Data?

    If you would like additional details on Green Travel Data, or you're a business, travel management company or online booking tool provider who would like access to this data, please contact This email address is being protected from spambots. You need JavaScript enabled to view it..

    Is the Green Travel Data methodology independently validated or accredited?

    Central to the ethos of Green Travel Data is the aim to develop and set of data that is accurate, impartial and trustworthy. To achieve this, we have word with sustainability experts to ensure our methodology that meets these aims. 

    In addition, we have worked closely with the UK Statistics Authority to ensure that our methodology follows their Code of Practice for Statistics for official statistics. Having demonstrated our commitment to Trustworthiness, Quality and Value we have been added to their list of Voluntary Adopters of the Code. 

    Read our statement of voluntary compliance <link to a page containing the below italic text> 

    In addition to this, we are in the process of attaining ISO 14083 Accreditation which relates to the quantification and reporting of greenhouse gas emissions arising from transport chain operations. 

    Statement of voluntary compliance with the Code of Practice for Statistics

    Rail Delivery Group (RDG) have designed and developed Green Travel Data, which is a commitment by the rail industry to calculate and publish a set of per-passenger   emission values for all rail journeys on the National Rail network. The data is available free of charge via the industry data repository, The Rail Data Marketplace and is intended to be the most accurate and representative source of data for public facing journey planners and as a resource to industry policymakers. To demonstrate our commitment to impartiality and accuracy, we have adopted the principles of the Code of Practice for Statistics when sourcing and processing data for this project. 

    Whilst its aim is to demonstrate the environmental credentials of rail travel, it strives to do so by sourcing the most accurate data available relating to: 

    • passenger numbers for each individual journey 
    • fuel and energy consumption data for each train fleet 
    • station to station distances for all rail stations 

    It is also our aim to process the data in the most representative way, and to regularly refresh the results to reflect the latest timetables and passenger numbers and any additional or more accurate datasets.  

    To ensure the results are as accurate and impartial as possible, the key datasets used are well established having been refined over an extended period of time by stakeholders with a collective imperative to ensure accuracy and impartiality. In many cases, they are used in financial calculations, so the independent desire for accuracy can be assured. 

    To demonstrate we are following best practice throughout the process we have voluntarily adopted the UK Statistics Authority Code of Practice for Statistics and to ensure that our results meet the three key areas of the code – 1. trustworthiness, 2. quality and 3. value. 

    This document complements the detailed Green Travel Data methodology and companion FAQ document which are published on the Rail Delivery Group website, within the Green Travel Data section. <link https://www.raildeliverygroup.com/uk-rail-industry/green-travel-pledge.html> 

    The principles of the code will continue to form the basis for future refreshes and expansion of the Green Travel Data. 

    What is the Code of Practice for Statistics?

    The Code of Practice is a framework by which official statistics should be compiled. The framework for the code is based on three pillars: 

    Trustworthiness 

    Confidence in the people and organisations that produce statistics and data. 

     Quality 

    Data and methods that produce assured statistics. 

     Value 

    Statistics that support society’s needs for information. 

     Any organisation that produces data, statistics and analysis can choose to apply the code to help them produce outputs that are high quality, useful in supporting decisions, and well respected. 

     Green Travel Data has chosen to apply the principles of the code, details of how are outlined below. More information on the Code of Practice for Statistics is available on the dedicated website.

    How do we apply the Code of Practice?

    Trustworthiness: We strive to ensure that Green Travel Data is trustworthy in intent and in practice. We also strive to be impartial in the way we gather, process and disseminate information. 

    • Honesty and integrity (T1) – The analysis undertaken as part of Green Travel Data follows the Seven Principles of Public Life and be transparent and auditable in how it does so. 
    • Independent decision making and leadership (T2) – Governance of each data set sits with the experts of the respective areas. The subject matter experts (SMEs) will advise on how the data is used, but the impartiality of its usage will be independently governed by the Green Travel Data Project Board. 
    • Orderly release (T3) – Updates will be released at regular intervals with all updates managed via the Rail Data Marketplace to ensure users are aware of changes. Data will also shortly be provided via an API so that any refreshes automatically filter through to the end user. 
    • Transparent processes and management (T4) – Internal governance and engagement with industry stakeholders and data suppliers will ensure that the processes by which the data is generated are well understood through regular reviews of the available data and rigorous data processing checks. The methodology is also clearly documented to ensure those consuming it, can do so appropriately. 
    • Professional capability (T5) – Extensive engagement with SMEs from all data sources and regular consultation ensure that those with the best skills and knowledge in each area was involved throughout the project development process and will be as it is expanded and updated. 
    • Data governance (T6) – By making the data available only through the Rail Data Marketplace, access is limited to approved parties only. Further phases will see the data available through an API, which will ensure that only the current data is being consumed in the way it is intended. This allows us to monitor for incorrect usage. 

    Quality: By engaging with subject matter experts within the rail and sustainability industry and beyond, also by seeking the most accurate and appropriate base data, Green Travel Data strives to make its outputs as accurate as possible 

    • Suitable data sources (Q1) – GTP has undertaken exhaustive consultation with SMEs from a variety of disciplines both within and outside the rail industry at the project scoping stage. This has identified the most accurate available data sources required to calculate both the number of passengers on each train, and the emission value of the rolling stock used. We continue to engage with SMEs to ensure that any new and more accurate data sources are incorporated.  
    • Sound methods (Q2) – The methodology (which was created by an independent SME with ISO14083 accreditation) has been subject to extensive rail consultation and is published within the Rail Data Marketplace and in a set of FAQs on the RDG Green Travel Data webpage, with feedback from stakeholders encouraged. These are revisited regularly and have been independently reviewed for appropriateness. 
    • Assured quality (Q3) – Various safeguards have been put in place to crosscheck processes and results for inadvertent errors and any systemic issues. A process of continual review is in place. The process to attain ISO14083 accreditation is being progressed. This will ensure we are following the established methodology for quantification and reporting of greenhouse gas (GHG) emissions arising from the operation of transport chains of passengers and freight. 

    Value: We aim to maximise the value of the data we provide by understanding the needs of consumers of it as much as possible; and working with them to present it in a contextual and easy to understand way. 

    • Relevance to users (V1) – We present Green Travel Data regularly at rail industry and travel industry events so that stakeholders, users and potential users of the data can feedback and we can continue to develop the accuracy and value of the dataset. It is also presented in a way that allows meaningful comparison with other transport modes. We actively encourage new stakeholders to get in touch via a dedicated email address. 
    • Accessibility (V2) – Data is available free of charge by organisations registering through RDM. Full access to the data is available to individuals via our public facing carbon calculator. A detailed methodology is also available and detailed Q&A is publicly accessible and provides an explanation of Green Travel Data in less technical language.  
    • Clarity and insight (V3) – We are working to make the data available, contextually at point of sale (i.e. through online journey planners) so people can easily understand what it means to the journey they intend to make. 
    • Innovation and improvement (V4) – We will continue to work with the rail industry and beyond to identify and consume any new data sources that may improve the accuracy, granularity or immediacy of the information Green Travel Data provides. As an example, we are looking to refine the modelled passenger loading figures by factoring in real time passenger loading figures. 
    • Efficiency and proportionality (V5) – We continually work with stakeholders and SMEs to improve the efficiency by which we gather, process and disseminate data. We are actively working to ensure that all appropriate parties have the opportunity to feed into and consume the data. 

    Questions about how to use carbon emissions calculation data

    Is your carbon emission data specific for train operators running the same route?

    Many tickets offer "any route permitted" travel between two stations so we provide a figure for the station-to-station journey, which averages out all rail services running along that route to take into account the flexibility provided. The exception would be if your fare specifies only a specific route; in that case we will calculate it according to the train operator providing that specific service and route.

    Will the data be available to consume via an API?

    We plan to release an open API/data feed in the next phases to allow travel management companies, online booking tools and other business travel providers with the opportunity to consume the carbon emission data and supply it to business travellers at the point of sale.

    How can I access the Green Travel Data data?

    Green Travel Data carbon emission data is available via the Rail Data Marketplace (RDM). RDM is a central platform for finding and sharing rail data, allowing us to share data with multiple parties quickly and easily via a number of formats.


    Business travel webinar series

    Infographic showing a business man walking in a train station on his phone. Title says "Business travel on our rail network"

    Business Travel on our Rail Network - March 2024

    18/03/24

    An update on new Green Travel Pledge for the top business routes across Britain.

    Infographic showing a business man walking in a train station on his phone. Title says "Business travel on our rail network"

    Business Travel on our Rail Network - December 2023

    07/12/23

    An update on rail usage, Green Travel Pledge, Rail Data Marketplace and the business travel messaging framework.

    Slide showing mobile phone screen with Passenger Assistance app on it

    Accessibility and Inclusivity on our Railway Network

    22/05/23

    An introduction to efforts to make the railway accessible to all, through Passenger Assist and other services.

    A train travelling through green countryside.

    Green Travel Pledge – A Rail Industry Initiative, led by RDG

    28/03/23

    An introduction to the Green Travel Pledge, a rail industry to provide detailed, accurate and reliable data on the carbon emissions of rail journeys

    Powerpoint slide showing Railway Guardian phone app

    Safety and Security on our Rail Network

    28/02/23

    An introduction to activity by RDG and the BTP to improve safety and security on Britain's railways.


      Collaborative partners

      Travel research & insights partner